34 ASUS System Management Software User’s Manual
ASWM for Windows
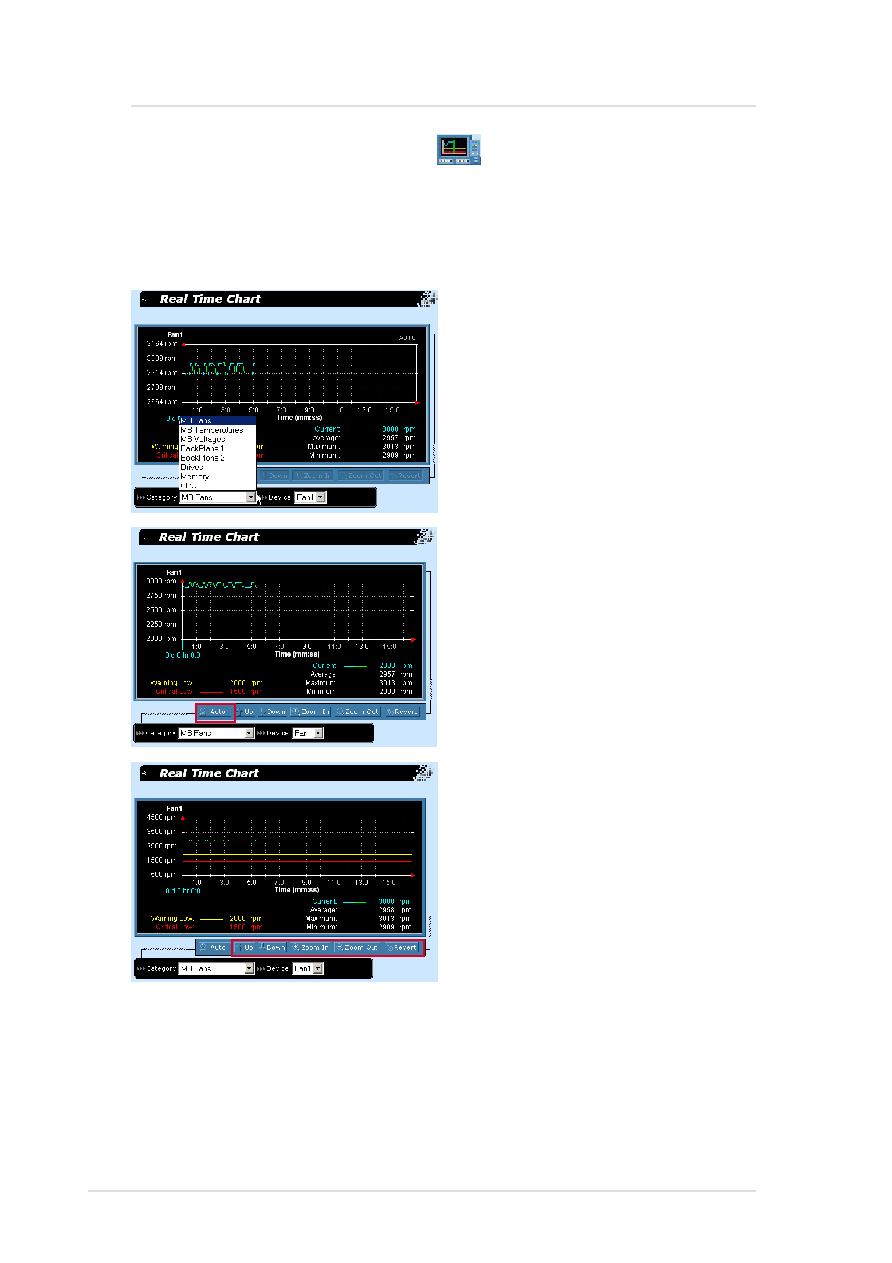
System Real Time Chart
Every value that you see in the ASWM corresponds to data while you
are in the Real Time Chart view. So you cannot see historical values.
You can let the Real Time Chart run over a few days to discover the
highs and lows of a particular monitor.
If the “Manual” button is avialable,
click on it to show chart navigation
buttons: Up, Down, Zoom In,
Zoom Out, Revert.
You can choose to chart fans,
temperatures, voltages, backplane,
drives, memory, and CPU. After
choosing a category, choose the
specific device. (You cannot chart
multiple devices or multiple
categories.)
Up: scroll up on the chart
Down: scroll down on the chart
Zoom In: zoom in on the chart
(If you zoom in and data is no longer in
view, wait a few seconds and the chart
will automatically scroll to the data.)
Zoom Out: zoom out on the chart
Revert: reverts to default zoom
(not the same as auto)